Blue Power
Soft realtime telemetry for high-frequency measurements.
Overview:
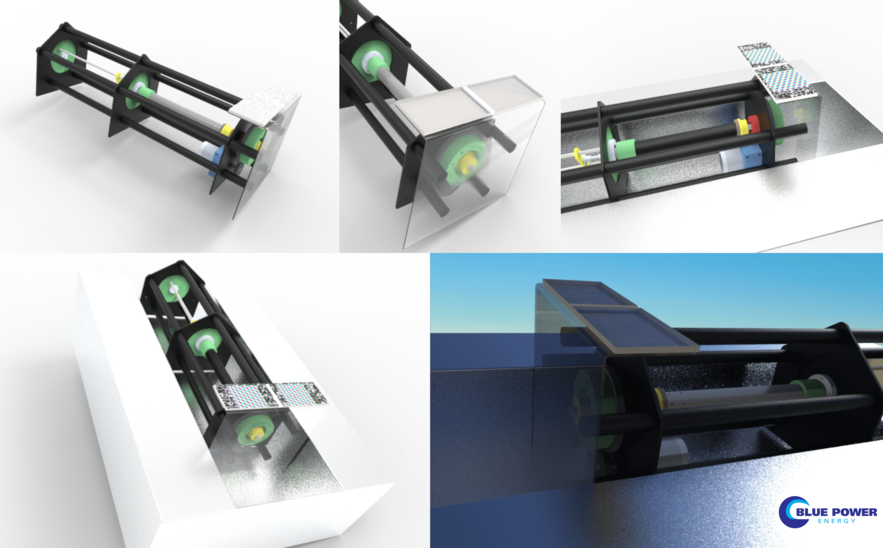
The unending motion of seawater presents a massively untapped source of useful energy. The Blue Power mechanism for harvesting wave energy consists of a floating barge holding a Power take off unit (PTOU) (figure 1). This PTOU is a pure mechanical device that converts linear motion to rotary motion. The PTOU is tethered to the sea floor by a cable. The distance of the cable, from the barge to the seafloor, is variable and determined by the waves, tides, and sea-level. As the barge rises and falls with the water level, the cable is tensioned and released from the system with an approximate stroke of 800mm. This engages the PTOU, which couples wave energy to a desalination pump. The desalination pump effectively intakes sea water and outputs desalinated water. The current project is concerned with measuring key operational aspects of the system in order to provide measurable metrics to examine the overall effectiveness. Metrics include:
- The stroke of the cable.
- The tension of the cable.
- Water pressure in the desalination pump.
- The fluid flow rate through the pump.(Flow Rate at exit of clean desalinated water)
- The movement and orientation of the barge in three-dimensional space.
Controllino Mega:
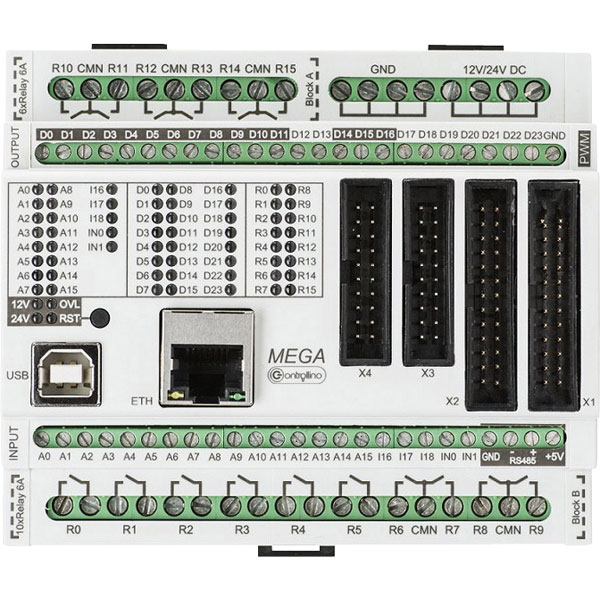
The Controllino Mega is a Programmable Logic Controller (PLC), built on Atmel’s ATmega2560 chip, and compatible with the Arduino open-source programming language (figure 2). Programs can be written in arduino syntax, compiled to C code and uploaded using various programmers such as STK500 or AVRISP mkII. Controllino PLCs use on-chip flash memory, perform complex switching operations and importantly they are capable of reading voltage inputs as scalar values. For analog voltage inputs, the potentials are perceived as byte integers ranging from 0-1023. This number is mapped to a voltage between 0V-26.4V when the Controllino is powered by 24V.
Docker:
The docker containerization technology is useful for small devices in the IoT sphere. The HypriotOS allows the Raspberry Pi to run docker images, which makes deployment to such devices very easy. By creating a custom container for our Python app, we ensure it can be run on any small device with a docker-compliant OS. Containerization is well-suited for small devices because it is so much lighter than full VMs. Moreover, the underlying hardware can be switched, and even the OS can be switched, so long as they can run docker. In terms of deployment, docker automates the usual processes of creating users, groups, databases and network connection credentials. The docker versioning system allows incremental improvement of the system.
Materials and methods:
Materials:
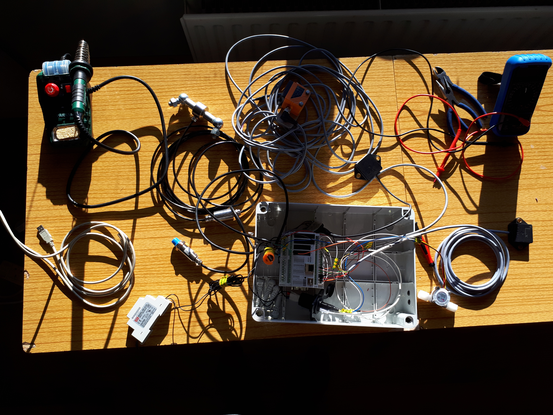
The data acquisition system consists of the following pieces of hardware:
- 2 Numax 24MF Lead acid Batteries.
- 2/4 Marine Solar Panels.
- 1 Land Start PWM Solar Charge Controller.
- 1 Controllino PLC for collecting voltage data from the sensors.
- 1 Raspberry Pi 3.
- 1 mobile internet modem.
- (Amazon Web Services) AWS server for database and website hosting.
- 1 X-Y inclinometer.
- 1 X-Y-Z accelerometer.
- 1 Flow meter.
- 1 Fluid Pressure Sensor.
- 1 Wire Tension Sensor.
- 1 Laser Distance Sensor.
Software Architecture:
The data acquisition system consists of the following programmes and their typed languages:
-
Compiled C code, flashed onto the Controllino, continuously reads analog inputs at certain ports(see section: sensor wiring). The analog signals are mapped to the millivolt range and the corresponding Millivolt integer for each input is sent via usb to the Raspberry Pi as an ‘n-terminated’ line. For the fluid flow meter (Hall effect sensor), the voltage input is attached to an interrupt pin, which continuously counts the number of pulses as determined by the flow rate through the sensor. Every second, the controllino averages the number of pulses that has occured and converts this number to a corresponding flow rate.
-
A Python programme run inside a docker container on the Raspberry Pi 3. This programme reads the serial input from the Controllino, appends a ‘timestamp’ to the incoming ‘n-terminated’ line of data and puts the data onto two queues. One queue is directed towards a local Postgres database on the Pi for local data logging. The other queue is directed towards a secure websocket channel, which is hosted on a remote server (see next section). The programme is secured against database overflow and network disconnection (and slow speed).
-
An Elixir Phoenix Programme running on an AWS Ubuntu server. This program has a websocket channel that accepts connection from two distinct user types. This design prevents human interference and allows only measurement machines to log data. When a measurement machine pushes data to the channel, the data is saved to a local database and simultaneously broadcast to all other users. Normal users are not permitted to create data (for security reasons), but can only view incoming data and pull historic data in csv format. All communications with the server are encrypted using SSL certs. All HTTP requests are redirected to HTTPS.
-
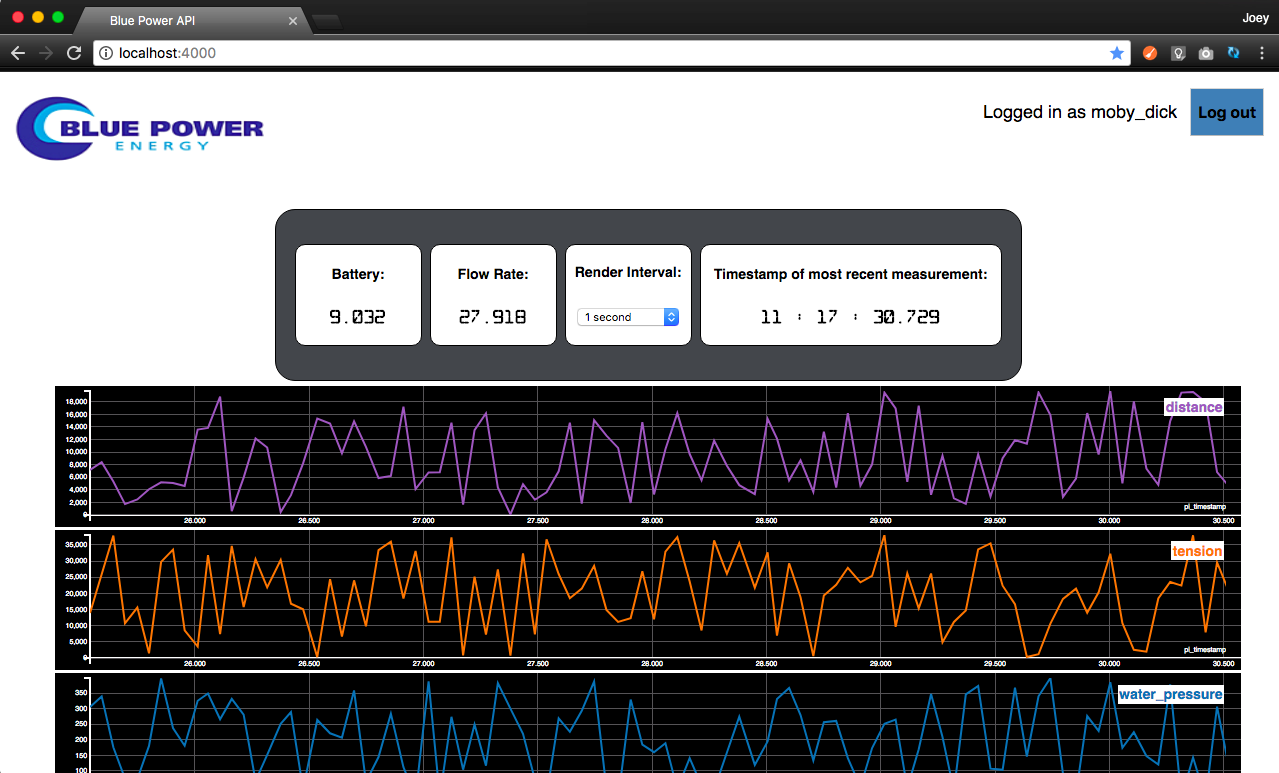
A ReactJS website, which utilizes the D3 JS Graphing Library to present the data in real time (figure 3). The website makes use of scalable vector graphics, which allow for rapid rendering of graphs. The website requires login credentials and is accessible to any kind of user. The data is received over the aforementioned websocket channel. The website extends functionality to specify render frequency as different devices have different CPU capacity. It is noted that certain devices cannot render at a high frequency. Following several strategies to render data visualisation, the authors conclude that React JS combined with D3 JS is the most efficient.
Power Supply:
The intended source of power for this system is 24 VDC. This power supply can be connected to the power bus of the Controllino (figure 2). The Controllino power bus can then power all sensors, with the exception of the xyz accelerometer. The xyz accelerometer should be powered from the 5VDC power supply on RS485 section of the Controllino (figure 2). The Raspberry Pi and internet modem require 5V power supplies. A 5V usb charger can be connected to the 24V power bus and used to power the Raspberry Pi. Accordingly, the internet modem can then be powered from a USB port on the Raspberry Pi.
Sensor wiring:
Sensors should be attached to the following Controllino pins:
- CONTROLLINO_IN0 - flow_meter_pin;
- CONTROLLINO_A0 - distance_sensor;
- CONTROLLINO_A2 - wire_tension_sensor;
- CONTROLLINO_A3 - fluid_pressure_sensor;
- CONTROLLINO_A4 - Inclinometer_x (White wire);
- CONTROLLINO_A5 - Inclinometer_y (Black wire);
- CONTROLLINO_A6 - accelerometer_x (Brown wire);
- CONTROLLINO_A7 - accelerometer_y (Green wire);
- CONTROLLINO_A8 - accelerometer_z (Pink wire);
- CONTROLLINO_A9 - battery ;
The Controllino should be powered up and connected to the Pi before starting the Pi. If the Controllino is unplugged and plugged back in, the Pi must be restarted. The reason for this is due to a limitation of the docker containers - they cannot rescan the /dev folder for new devices after they are instantiated, no matter how high their privileges.
Translate voltage readings:
The sensors used in this system are calibrated so their voltage outputs correspond to their perceived environment variables. In order to make use of this, the Elixir programme performs computations on the incoming data to output practical metrics:
-
Flow-rate = (chosen-measurement-interval / time-elapsed) * pulse-count) / calibration-factor. Calibration factor = 73 pulses/minute
-
Wire Tension = 1.9977043 * voltage - 0.18737215. Coefficients were calculated using tensorflow as the calibration curve is slightly nonlinear.
-
Water pressure = 20 * V / 1000. Output Voltage range of 0-5 V corresponds to 0-100 bar.
-
Incline:
- angle_x = Math.deg2rad((voltage5 / 80.0) -31.25)
- angle_y = Math.deg2rad((voltage6 / 80.0) -31.25)
- Acceleration calculations has to consider g forces and incline of system:
- accel_x = ((voltage7 - ZMO_x) / SENS_x) - (Sin(angle_x))
- accel_y = ((voltage8 - ZMO_y) / SENS_y) - (Sin(angle_y))
- accel_z = ((voltage9 - ZMO_z) / SENS_z) - (Cos(angle_x) * Cos(angle_y))
| Accel axis | Sens (mV/g) | ZMO (mV) | | ------------- |:-------------:| -----:| | X | 994.9 | 2473.9 | | Y | 995.2 | 2479.3 | | Z | 1001.2 | 2449.5 |
These translated readings are broadcast to the frontend visualisation and are the default for csv downloads. In the interest of best practices, raw voltage data is also collected, in part to mitigate against the unlikely possibility that there was error in any of these calculations.
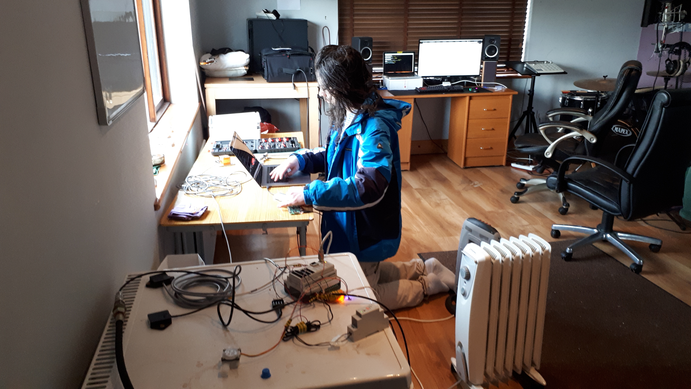
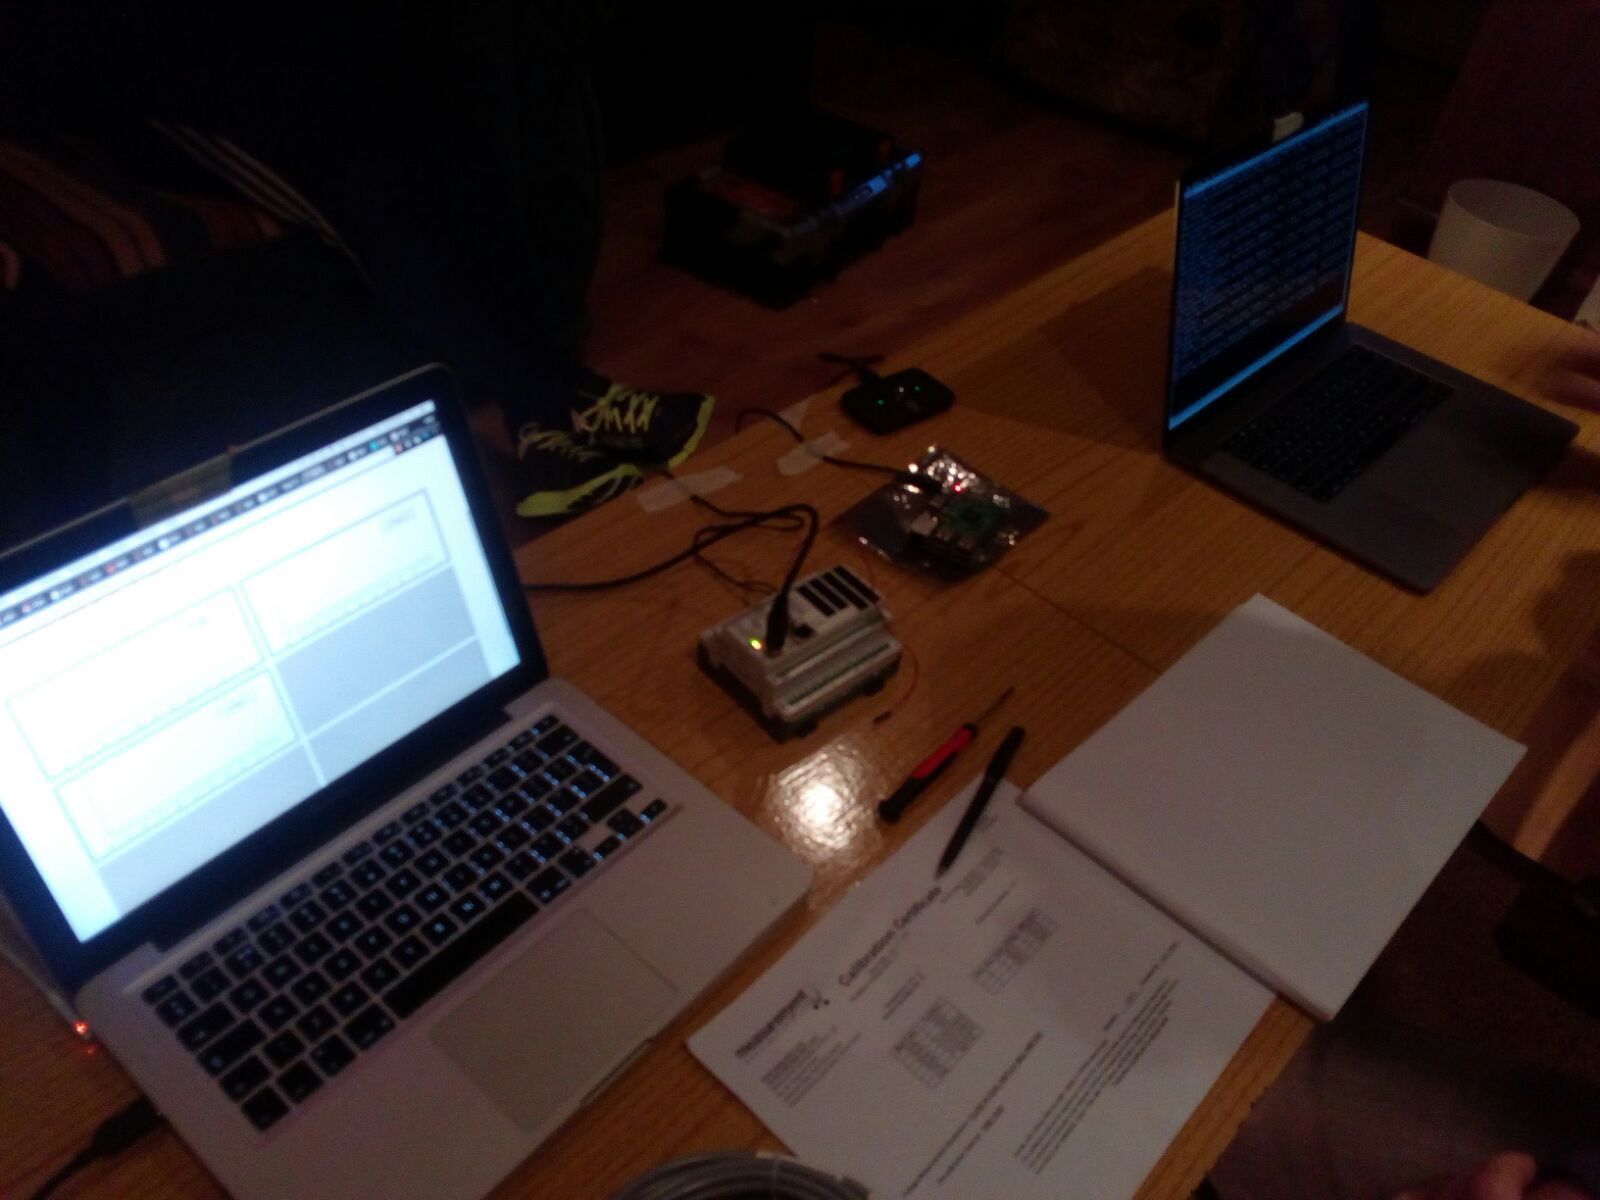
Flume Tank Testing
The Blue Power wave energy machine was transported to Hanover, Germany where it was deployed to a flume tank for some initial testing. This is how it went.
and here is how our live dashboard was looking while this was going on: